Polymarket’s BTC five-minute up/down markets look like a coin flip: one side settles to 1, the other to 0. What actually extracts money in the book is often not a better directional call—it is a machine that rebuilds the same position every few seconds.
According to one public tracking run: someone followed about 2,500 always-on bots for 28 days (the materials cite 9/6–10/3); only about 32% finished profitable, and the median was reportedly a $59 loss. Those same machines reportedly absorbed about 70% of market volume. Low hit rate, high share of flow—suggesting the edge is not mainly “calling it right,” but pricing, execution, and inventory engineering.
Put the main loop on the table first; the seven steps below are pieces of it:
new data → fair value → executable edge → position structure → order → check inventory → rebalance → repeat.
Step 1: Price it yourself—do not treat the touch as fair value
The book price is only one input. Mature systems watch several signals at once: how far BTC is from the open, how fast this move is, short-horizon volatility, seconds left, two-sided depth, bid/ask liquidity—plus existing inventory, resting orders still on the book, and related short-horizon BTC/ETH/SOL markets. Nine inputs go into the model together.
Example: Up is offered at 43¢ and BTC suddenly prints above the open. A directional trader just sees “bullish.” The machine asks how much that new information should move the probability.
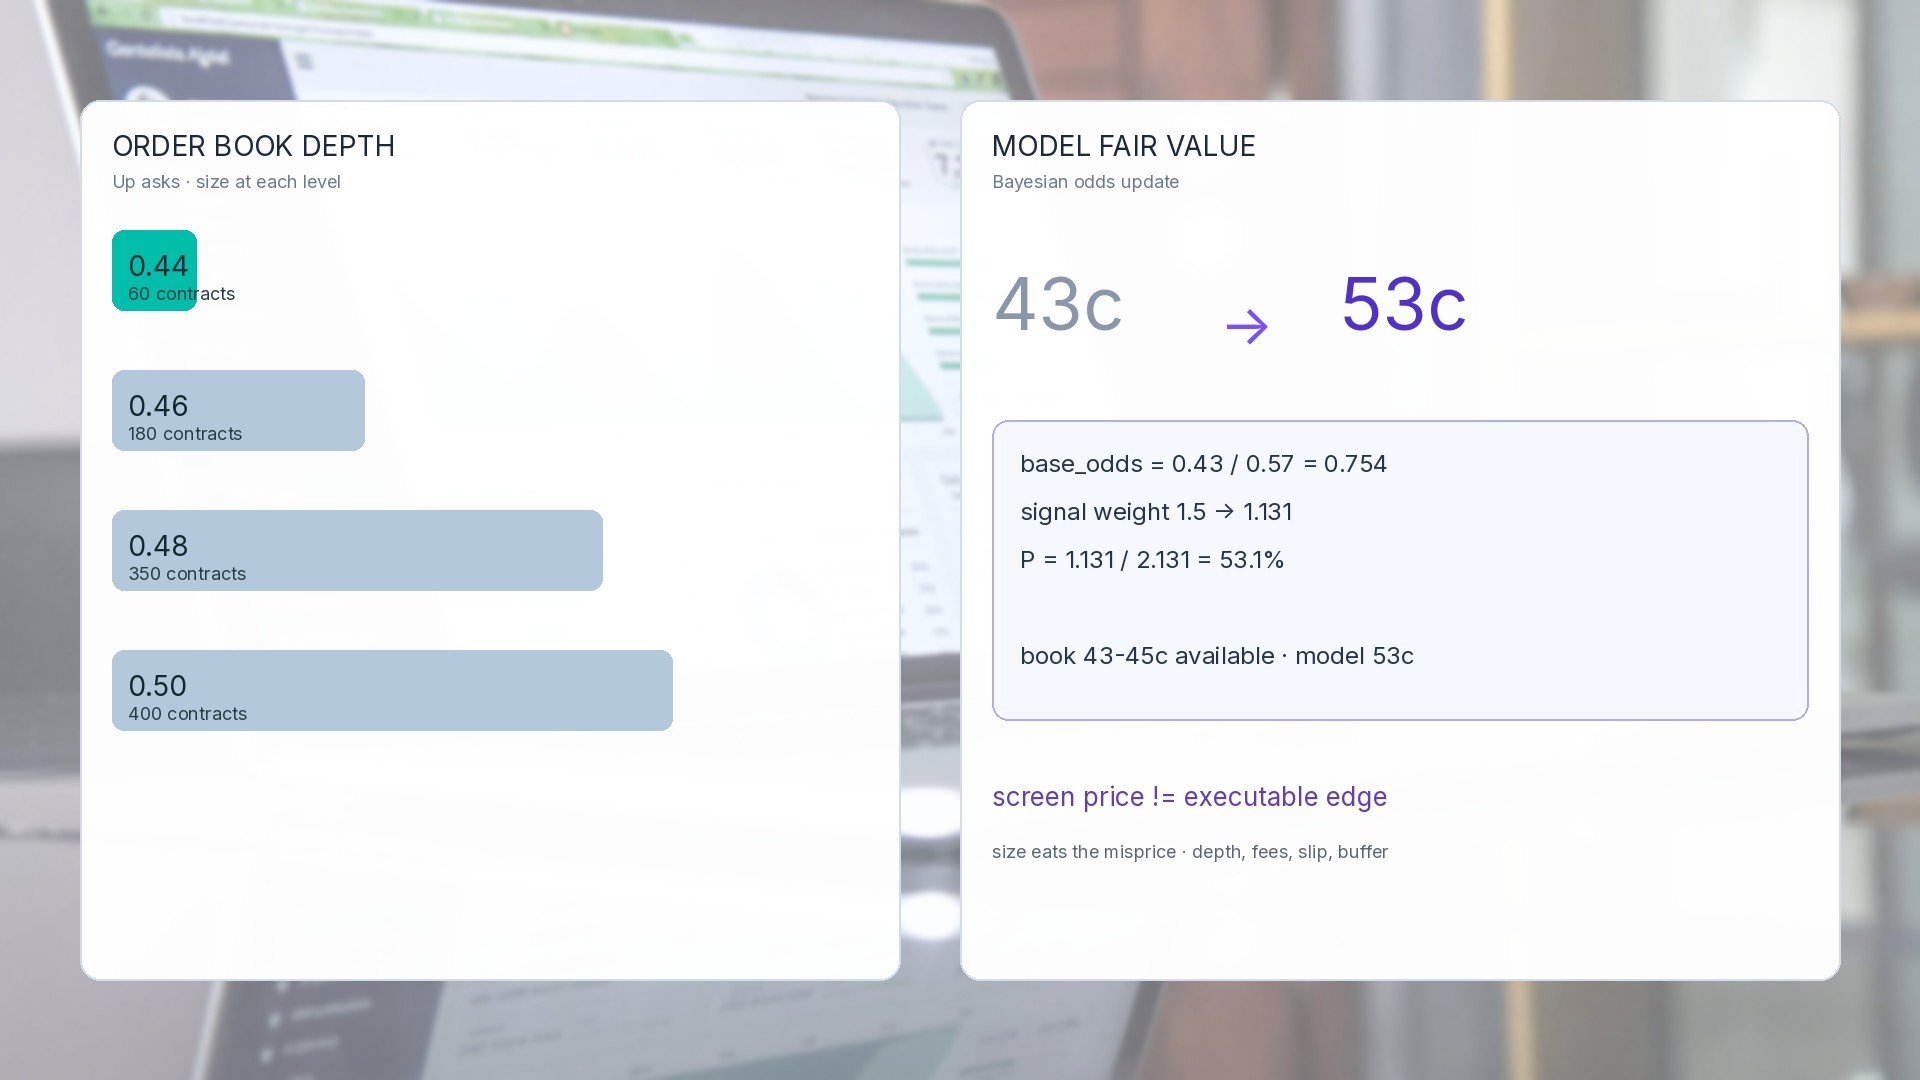
Bayesian update on odds: base_odds = 0.43/0.57 = 0.754, signal weight 1.5 → 1.131, convert back 1.131/2.131 = 53.1%. Roughly 43% is pushed to about 53%.
The model then says the contract is worth 53¢ while the book can still be lifted at 43–45¢. A gap appears. That is still not an order—the system does not yet know whether that gap is actually executable.
Step 2: Compute executable edge, not the edge on the screen
The screen price is not your fill. Model at 53¢, best ask 44¢—looks like 9¢ of edge. But 44¢ may have only 60 contracts.
Walk the book: 180 at 46¢, 350 at 48¢, then levels near 50¢. To buy 590 contracts, the size-weighted average is the real entry.
So before sending, systems typically net six frictions: adverse selection from walking depth, spread, fees, slippage, partial fills, and model uncertainty.
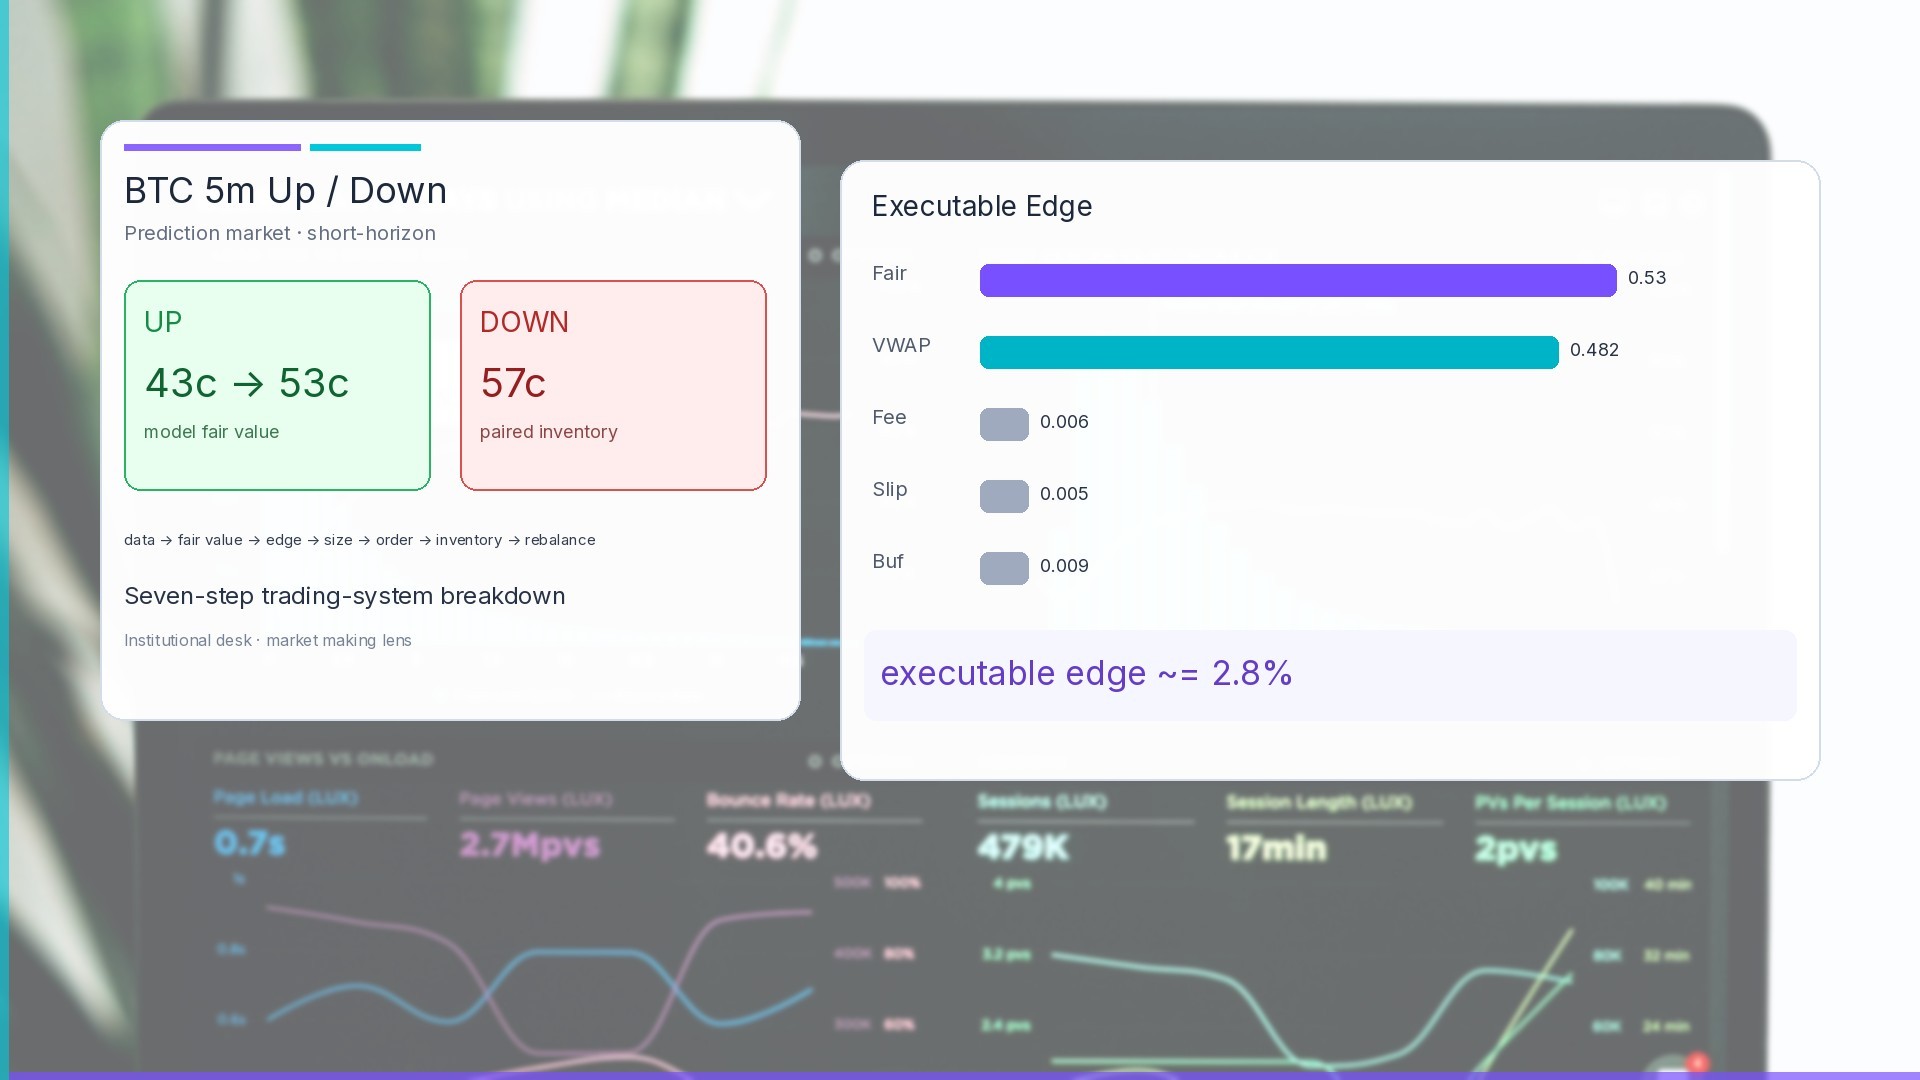
Walk the numbers: fair 0.53 − expected average fill 0.482 − fee 0.006 − slip 0.005 − uncertainty buffer 0.009 = executable edge about 2.8%. Positive—but only 2.8 cents left.
Against the fee schedule in public materials: taker pays “shares × 0.07 × p × (1−p)”; at 50¢ that is about 1.75¢ per share, roughly 3.5% of notional; makers reportedly pay nothing and get about a 20% rebate. A 0.006 fee assumption in the model is often optimistic live.
That is also why backtests that look sharp die in production: the misprice may live only in the first 50 contracts; by the time you try for 2,000, you have eaten it yourself.
Step 3: Up and Down are not two independent bets
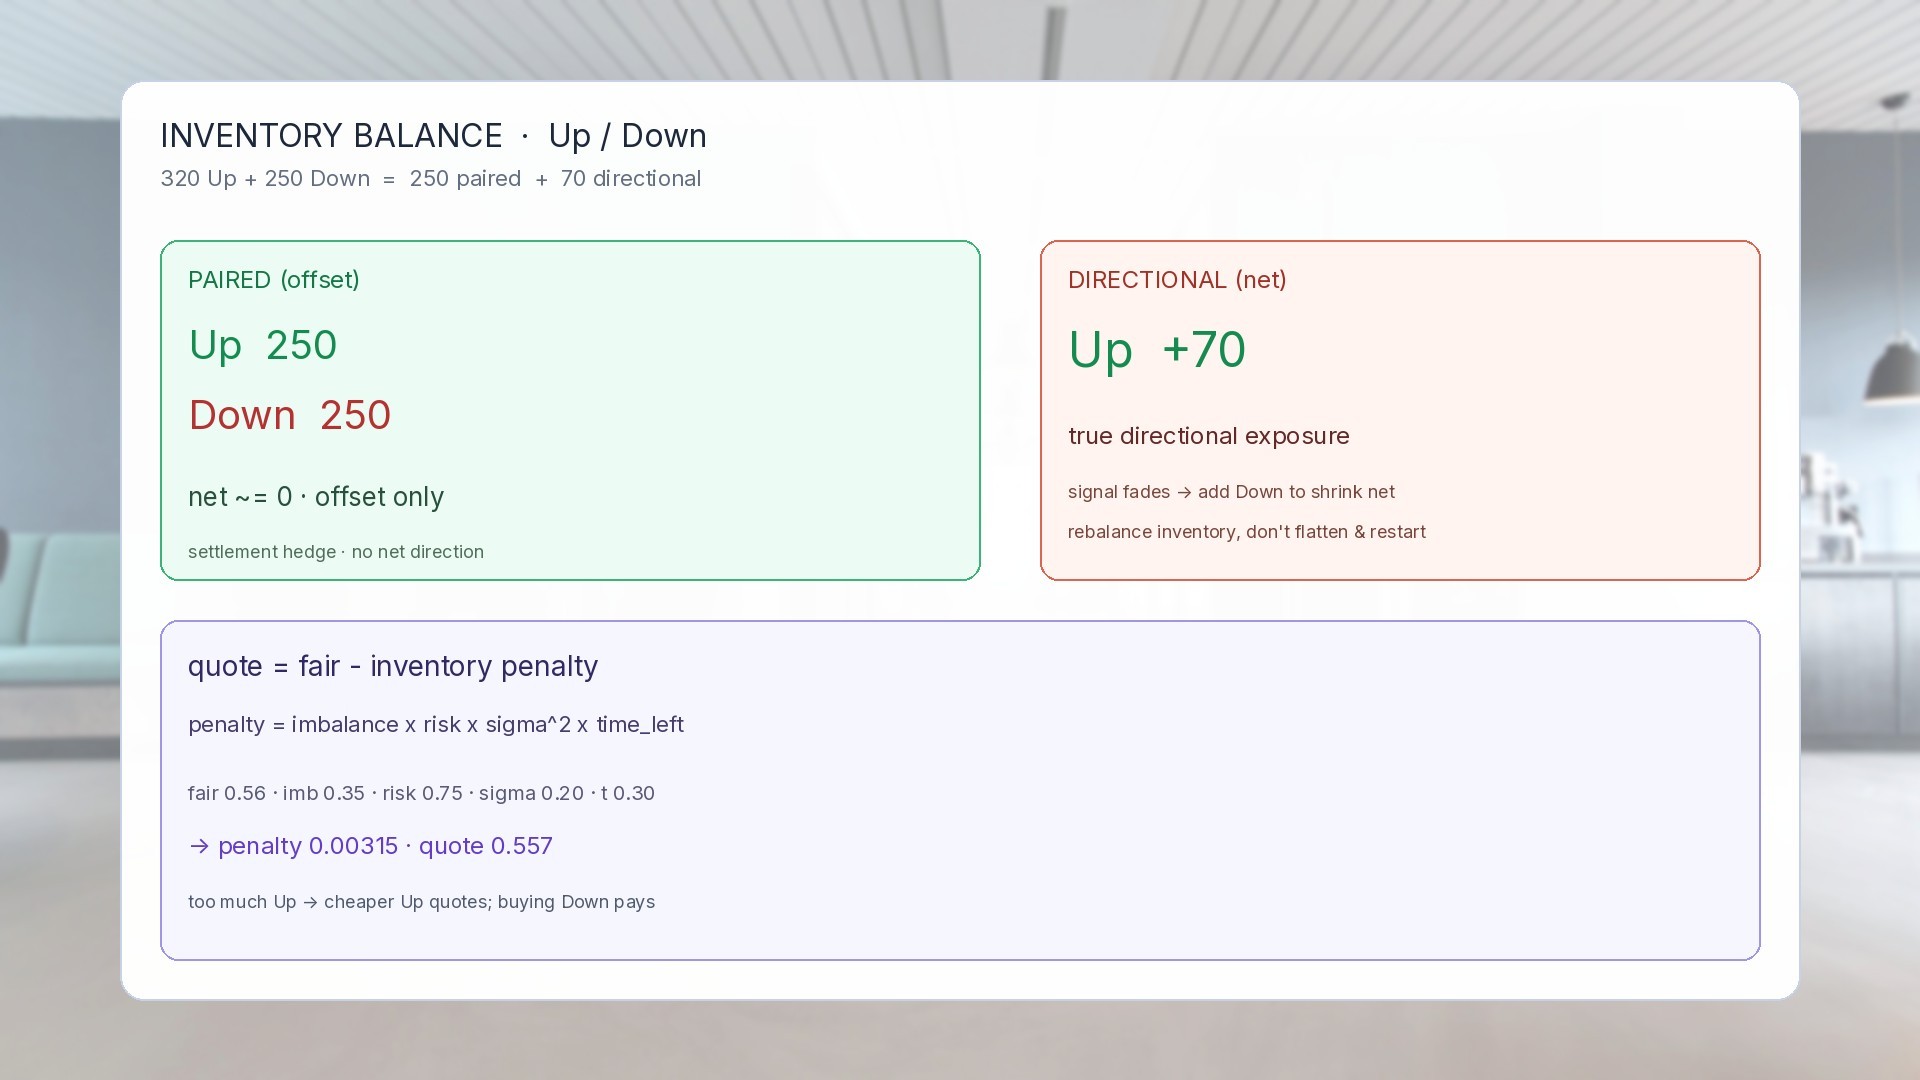
Ending with 320 Up + 250 Down is not two separate forecasts. 250 of each can pair off; the remaining 70 Up is the true directional exposure.
Economically it is: 250 paired + 70 directional.
When the signal fades, the system often does not dump Up—it adds Down to shrink net exposure; if BTC strengthens again, it leans back into Up. The book is rebalanced on existing inventory, not flattened and restarted.
So do not count fills as decisions. One large limit can slice into 5, 10, or 20 prints. Twenty fills ≠ twenty decisions.
Step 4: Stitch arb from prices that never coexisted
Classic two-sided arb buys both when Up + Down < $1 at the same moment. Short-horizon markets also allow another path: buy each leg at different times.
Walk-through: BTC spikes, Down dumps to 28¢—buy 200. A minute later BTC pulls back near the open, Up shows 47¢—buy 200. Pair cost 28 + 47 = 75¢.
The point: 28¢ Down and 47¢ Up never sat on the book together. The bot assembled the package from two moments along the five-minute path.
The risk is the same structure: after the first leg, price may never come back. Cheap Up never appears; you hold unpaired Down. Until the second leg fills, it is still a naked directional book.
Per public figures: same-time both-sides-under-$1 windows showed up in only about 0.9% of intervals. Waiting for a ready-made cheap package mostly means waiting forever.
Step 5: The hard problem starts after the first fill
Scene: target 500 Up + 500 Down. Up fills fully; Down only gets 140. BTC spikes, the remaining 360 Down get expensive, the original opportunity vanishes. Inventory is 500 Up + 140 Down.
Signal is no longer the main constraint—inventory is. The execution engine picks among six imperfect options: keep waiting on Down, chase the limit toward the touch, take liquidity, cut some Up, accept a worse hedge, or abandon the structure.
Mature quoting follows imbalance:
quote = fair − inventory penalty
penalty = inventory imbalance × risk coefficient × volatility² × time remaining
Numbers: fair 0.56, imbalance 0.35, risk 0.75, vol 0.20, time left 0.30 → penalty about 0.00315, quote pressed to about 0.557.
Too much Up means the next Up must be cheaper to add; buying Down is the trade that pays, because it shrinks exposure.
Step 6: Same BTC move—hunt the slow market across venues
The same BTC impulse scatters edge across several books: the current 5m, the next 5m, longer BTC markets, ETH short-horizon, SOL short-horizon.
Do not compare prices raw. One market’s Up at 69¢ and another’s at 55¢ does not make the second automatically cheaper: opens differ, time left differs, distance to settlement boundaries differs, volatility, liquidity, and probability shapes differ.
Method: fair-value each contract on its own. Market A at 69¢ with model 67¢ is already priced—or rich; market B at 55¢ with model 62¢ still has 7 cents of gap.
Humans see two markets; the machine sees one connected graph and goes for the node that is slow to react.
Step 7: Size itself changes the strategy
Three common styles: fixed clips of 100–120; slice the same exposure into dozens of small limits; or scale clip size with liquidity and current inventory.
Trade-off: small clips rotate smoothly between Up and Down; large clips capture more when depth is there—but one bad fill can blow directional exposure wide open.
Size the book before you use it: payoff = (1 − entry)/entry, full_kelly = (payoff × win_rate − lose_rate)/payoff, then multiply by a factor around 0.2.
Win rate 59%, entry 48¢ → full Kelly about 16%; one-fifth of that is about 3.2% of capital.
Then wrap hard caps: max capital per market, max unpaired inventory, total BTC/ETH/SOL exposure, correlation limits, daily loss kill-switch, auto-halt on feed or API faults.
To read a bot, rebuild the full cycle
Do not judge a bot from single fills. Rebuild the cycle: which side was first, true clip size, which prints belong to one order, when the opposite leg appeared, how average price moved, how much inventory paired off, how much directional risk remains, and how the book changed after each tick.
Public materials also flag two rule changes that killed a pile of older tactics: reportedly from mid-August 2026, five-minute settlement moved from last trade to a Chainlink 60-second TWAP, with settlement about two minutes after the window close; old and new rules disagreed on the winner in about 13.2% of windows. Last-second spike-to-decide strategies died with that change.
Edge does not come from one perfect entry. It comes from revaluing repeatedly, pricing execution cost honestly, and finishing the reshape before the opportunity is gone. Direction is only the first layer; the other six are engineering.
Figures and structure here are compiled from public tracking and write-ups, for understanding short-horizon prediction-market making; historical or reported results do not imply future performance, and trading can lose principal.