

According to a public write-up, someone ran a bot on Polymarket‘s five-minute Bitcoin up/down markets driven by Binance spot prices; public materials once cited daily gains on the order of about $700. Windows of that kind can show up more than a hundred times in a day. The figure comes from that public material — it is not a guaranteed result. The whole strategy compresses to one line: when to buy, at what price, and how fast.
The idea is not mysterious. The bot keeps watching BTC on Binance and maps that into what an “UP” share on Polymarket “should” be worth in cents. If that mapped price jumps more than 20 cents within five seconds and clears 60 cents, while Polymarket is still more than 10 cents cheaper than the mapped price, it buys in the same second. What lags is the quote, not the directional call itself. The trade is in prediction-market shares; the signal sits on a centralized exchange’s spot ticks — two clocks that do not sync leave a tradable gap.
What a Spread Window Looks Like
Example: a five-minute window opens with a reference near 83,200. With about two minutes left, Binance BTC rips from 83,215 to 83,330 in five seconds. Under the mapping, the theoretical “UP” price should lift from about 55 cents to about 77 cents, while Polymarket still offers around 56 cents — a gap of about 21 cents is the trigger. Short windows, sharp jumps, and two sides out of sync are what make a moment tradable.

These books refresh every five minutes; short pulses and quote lag keep recurring. The bot is not trying to call the next candle’s direction. It is eating the instant when “Binance has moved and Polymarket has not caught up,” before a human can confirm the click. Frequency is high; per-trade edge need not be large. The same rule rolls across many windows in a day. Some people call it a same-second spread hunter: you do not need to be right on the whole day’s direction — only to be first while the lag is still open.
How to Run It: Watch Binance First, Then Hunt the Gap
Polymarket prices are often set by people and bots that watch Binance; in practice, treat Binance as the first signal, not the other way around. Wait for a sharp jump, then compare the two sides: Binance moved first and Polymarket is still cheap before you open. In quiet ranges the two sides tend to stick together; the real seams are usually those few seconds of a hard jump.
The edge sits in roughly two steps. First, map Binance dollar prices stably into Polymarket share prices in cents. Second, compare every second; once a gap of about 10 cents or more appears, open on Polymarket in the same second in the direction of the Binance jump. Stable mapping, frequent comparison, fast orders — miss any one and someone else takes the window, or noise burns it. For people who write trading code, the hard part is rarely the formula; it is whether market-data subscriptions, order latency and reject retries can all fit inside the same second.

Sample Wallet Check
According to the public profile, the sample account Polymarket @dgdgt345dfgdf23 (proxy address 0x3d178f74200ebf54c5412a752bba6c52743402ec) joined around September 2026, with total PnL about +$73.5K, volume about $406K, 128 markets traded, largest single win about $10.9K, and current position value $0.
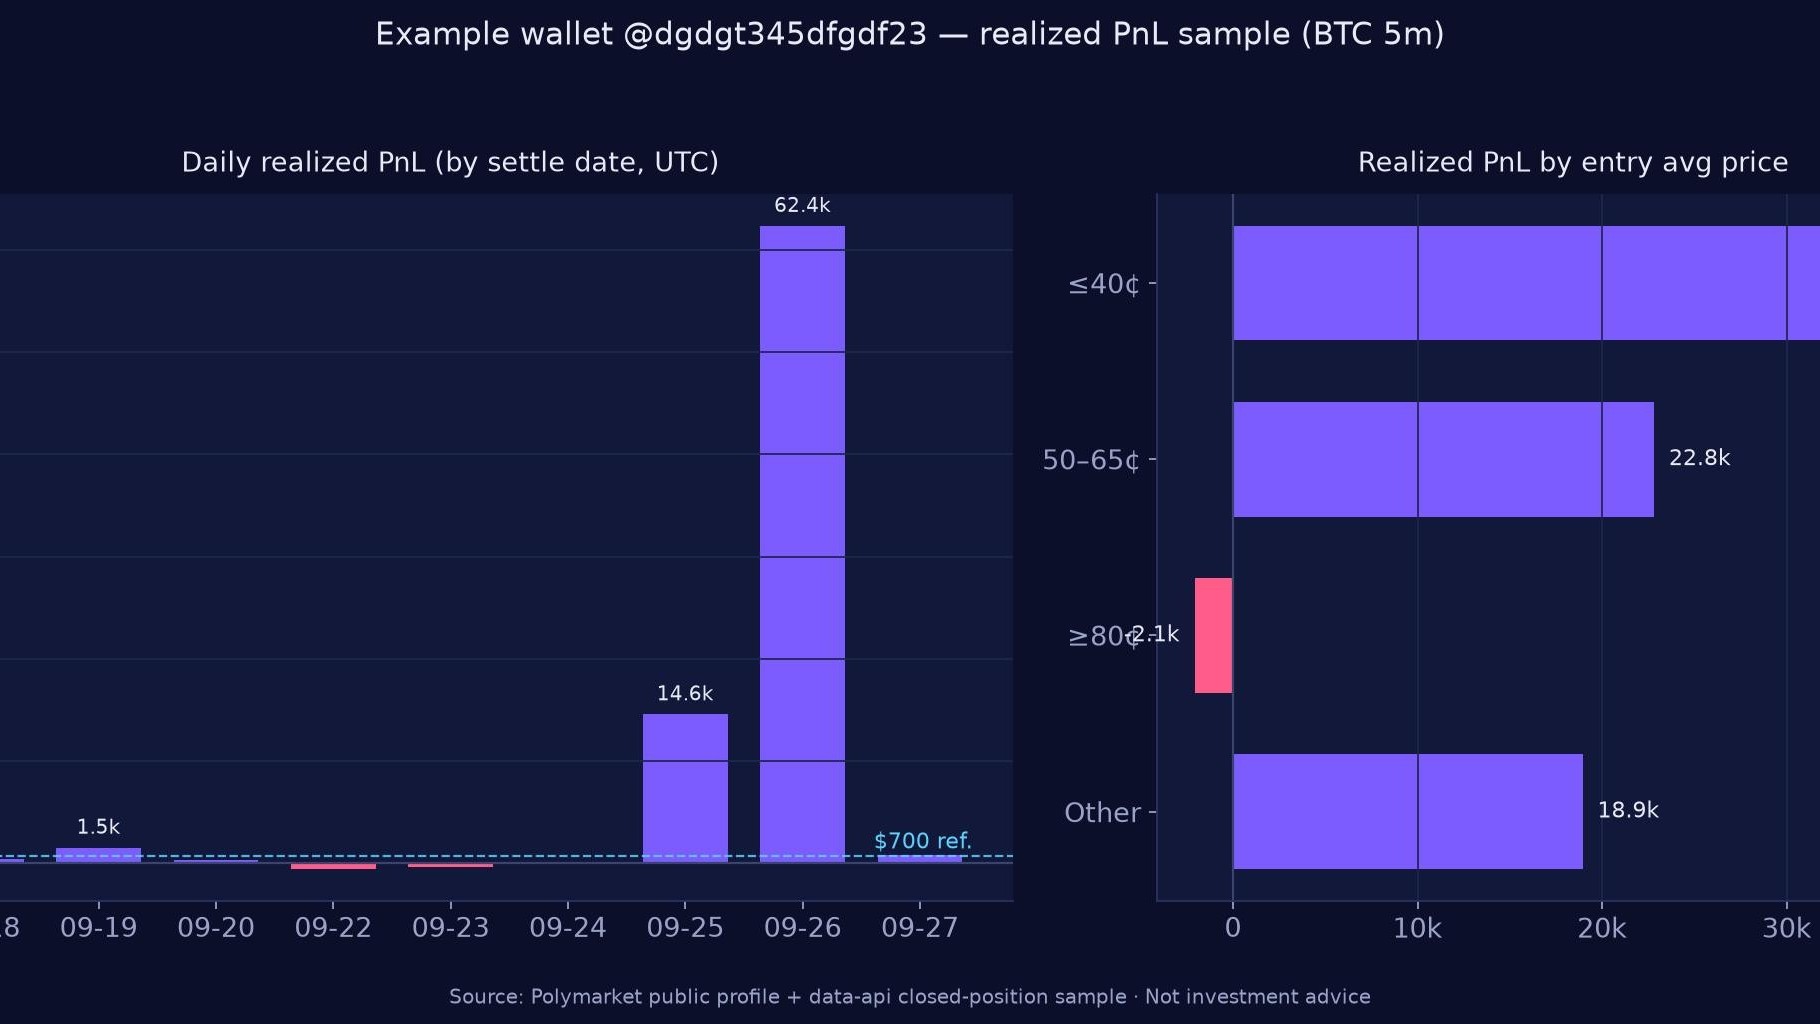
According to an API sample, fills clustered roughly from 2026-09-19 to 2026-09-27 (UTC), with little activity after; almost everything was BTC five-minute up/down. A settled-position sample of about 143 trades shows realized PnL near +$78.7K — the same order of magnitude as the profile. But PnL is highly concentrated: about +$15K on September 25 and about +$62K on the 26th, with many other days small wins or losses. The “about $700 a day” figure in public materials should not be read as a stable, observable daily wage.
Activity is mostly buys, held to settlement/redeem; there is no systematic mid-trade sell flat. On entry prices, many fills are ≤56¢, yet a large share of settled positions also average ≥80¢: the high-price band has a high win rate but nets near flat or a small loss; ≤40¢ has a lower win rate yet contributes most of the profit; the 50–65¢ band is closest to the “eat the lag” story. That can corroborate a cross-venue latency narrative; it does not prove a smooth daily rule can be extrapolated.
The chart below uses the same settled sample: daily realized PnL on the left (dashed line = the about-$700 daily-gain reference from public materials) and PnL by entry-average band on the right. Profit mainly comes from lower entry bands; the ≥80¢ high-win-rate band nets near flat.
One caveat: the oracle path used for settlement, and speed competition among similar latency strategies, both shrink live windows; publicly shared daily averages should not be extrapolated straight. Fees, slippage, rejects and brief disconnects also thin paper cent gaps. Treat it as a framework for watching cross-market delay — not as a stable money printer.
This article is for informational purposes only and does not constitute investment advice.