
Dodging a deep sell-off can matter more than calling the next bounce. According to a research report on Indonesian equities, a three-factor risk-management indicator cut buy-and-hold historical maximum drawdown from 41.5% to about 8.1% in out-of-sample tests. More interesting still: that improvement showed up after the researcher deliberately simplified an earlier specification—the version that looked polished in-sample went soft once it left the sample.
The work is by Hanifah Bagus Sulistyardi. The indicator is called SHIELD (Sulistyardi Hedging Indicator for Equity-Loss Defense). It is framed as a market-regime tool: it flags stretches where investors might first reduce equity exposure.
SHIELD does not stare only at the Jakarta Composite Index (IHSG) price itself. The public abstract stresses that IHSG is a capitalization-weighted benchmark whose largest single block of weight sits in a domestic banking cluster; historically, the index’s direction has also been sensitive to foreign portfolio flows and to Indonesia’s commodity-export cycle. Generic technical oscillators that only see the index level are often “blind” to that structure—they use the index itself, not the sub-blocks that drive it. SHIELD therefore looks at three sides of Indonesia’s financial markets that may carry broader regime information.
Three market signals, one risk-off call
SHIELD combines momentum signals from three market proxies:
- Infobank15: the domestic banking sector—material weight in Indonesian equities, and a stand-in for domestic credit and bank-related flow.
- TLKM (Telkom Indonesia): a foreign-ownership-heavy, relatively liquid name, used as a proxy for foreign-fund flow conditions.
- ITMG (Indo Tambangraya Megah): a coal-sector proxy for the commodity cycle.
The underlying idea is plain: if these influential market sides weaken together, that may show a deteriorating backdrop earlier than the broad index—before the weakness is fully reflected in the index level.
The research also lays out a scene common in systematic trading: a strategy that looks sharp after parameter optimization on history collapses on unseen observations.
The first SHIELD specification jointly optimized factor weights, a normalization window, and regime thresholds on the full historical sample. Out of sample, it was reportedly fragile.
The researcher then adopted two disciplines: fix factor weights in advance from market structure; hand only the risk-off threshold to a rolling walk-forward—calibrate on earlier data, then evaluate on later windows. The public abstract places that process in the backtest-overfitting literature (Bailey, Borwein, López de Prado, and others), with the calibration cadence following walk-forward-style practice (Pardo).
After that change, the reported out-of-sample numbers look materially more stable.

Maximum drawdown measures the largest peak-to-trough loss. The Calmar ratio sets annualized return against maximum drawdown—a way to ask whether the return earned was worth the hole endured.
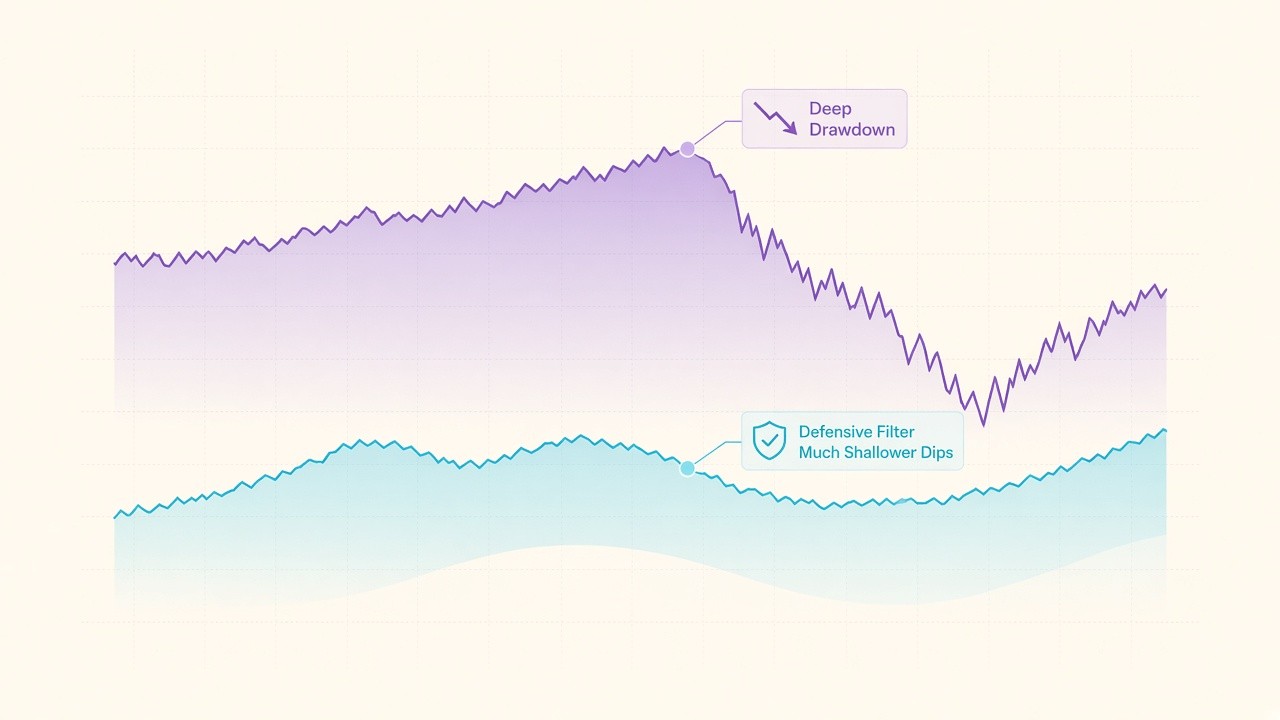
Per the public backtest report, SHIELD’s maximum drawdown was about four-fifths smaller than the buy-and-hold benchmark: roughly -8.1% versus -41.5%; out-of-sample Calmar about 3.53 versus about -0.12 for buy-and-hold.
That is a historical result worth recording. The abstract also states clearly that the paper does not prove the same protection will repeat in future crashes.
What systematic traders can take from SHIELD
Perhaps the more useful lesson is that SHIELD was never meant to pinpoint tops and bottoms.
The question it answers is narrower:
Under current market conditions, should the strategy keep equity exposure, or shift temporarily to defense?
That distinction leaves systematic traders a testable slot.
A reproducible contrast can be: ordinary IHSG buy-and-hold on one side; on the other, reduce exposure when SHIELD enters a risk-off regime and restore it when the regime improves.
Researchers can then check whether adding that market-regime filter improves drawdown, risk-adjusted return, and overall portfolio results.
A more informative extension is to compare it with a simpler time-series-momentum rule—for example, cutting exposure when the index breaks below its 200-day moving average. The public abstract’s further agenda explicitly points to controlled validation against a time-series-momentum benchmark (Moskowitz, Ooi, and Pedersen, 2012) and a longer history.
Only that comparison can show whether stacking banking, foreign-liquidity, and commodity proxies adds verifiable information beyond price momentum alone.
Boundaries, case study, and methodological contribution
The boundaries are clear as well.
The study describes a promising-looking out-of-sample result, but the framework still needs a longer history and more economic environments. All three proxies are Indonesia-local; the indicator may not transfer cleanly to other markets.
Trading costs, slippage, turnover, and whatever the defensive sleeve itself earns will rewrite live results. Public abstracts are often too thin to estimate those costs alone.
Compressing drawdown is also not the same as maximizing long-run return. A filter may dodge deep pits and also miss rebounds.
The abstract further uses the calibrated framework as an exploratory case: the IHSG decline associated with a temporary 2026 suspension of Indonesia’s MSCI market-classification status, and conditions around September 2026. That is a case illustration, not settled live validation. In framing, SHIELD is also explicitly rewritten as a binary risk-off regime filter rather than a precision entry-timing signal.
So the sturdier contribution may be methodological rather than “forecasting the next crash”: fewer parameters, and serious tests on unseen data, often travel better than optimizing a signal to the limit.
For markets where a few sectors can swing most of the index, regime filters deserve another round of backtests with real costs. SHIELD’s starting point is to ask not “can this predict the next crash,” but whether defensive signals, across cycles and after friction, can still improve portfolio outcomes.
That may be the more useful starting point for the next round of tests.
A further note: the same threshold on 22 names
A follow-up public abstract (same author) takes the IHSG-calibrated regime threshold—without re-estimating per stock—and overlays it as a binary risk-off layer on 22 Indonesia Exchange names: 15 Infobank15 banks, 4 coal names, and 3 foreign-ownership-heavy liquidity names; the out-of-sample window is reportedly October 2022 through September 2026.
Per that abstract’s framing, the filter’s benefits concentrate more on the domestic-bank side: Bank CIMB Niaga (BNGA) shows out-of-sample Calmar about 1.92 and Sharpe about 0.81, placed in a “very investable” band; Bank OCBC NISP (NISP) and Bank Mandiri (BMRI) are placed as “investable.” Across the three “investable or better” names, the win rate on closed buy-to-sell legs is reportedly about 91.7%; about 66.7% for the Infobank15 bank pool and about 31.3% for the four coal names. Across all 22, about 72.7% of sell signals were followed by a subsequent decline—again abstract-level figures, not a live-trading promise.
What may still be more worth testing next is the same old question: after real trading friction, can this defensive signal still stabilize portfolio results across different cycles.